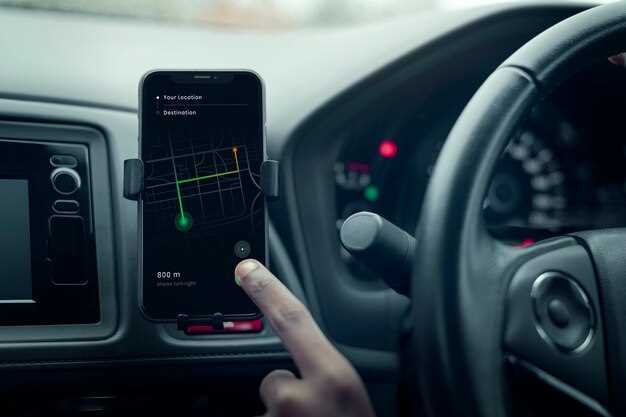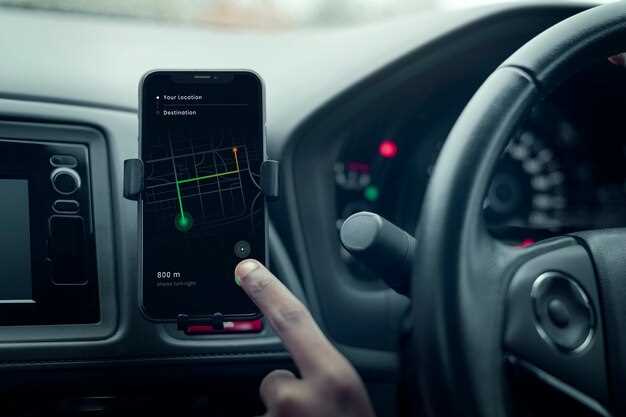
In the fast-paced world of motorsports, the ability to make split-second decisions can be the difference between victory and defeat. This is where smart dashboards and racing telemetry screens play a crucial role. By providing real-time data and insights, these advanced displays empower drivers and teams to optimize performance on the track.
At the heart of this technology lies an innovative approach to data visualization. Engineers and designers craft interfaces that prioritize essential information, ensuring that drivers can quickly interpret metrics like speed, throttle position, and tire pressure. As a result, these dashes transform complex data sets into actionable insights, enhancing both strategy and execution.
Moreover, the integration of telemetry allows for a deeper analysis of car dynamics and driver behavior. The display of historical data alongside real-time feedback enables teams to make informed adjustments during races, ensuring their vehicles are always at peak performance. Embracing these technologies not only amplifies the competitive edge but also elevates the overall racing experience.
Understanding Key Metrics Displayed on Racing Telemetry Screens

Racing telemetry screens are crucial tools for drivers, engineers, and teams, providing real-time data that influences decision-making on the track. These screens display various metrics, each serving a specific purpose in analyzing vehicle performance and driver behavior.
One of the key metrics is speed, typically displayed in miles per hour (mph) or kilometers per hour (kph). This data allows teams to assess how well the car is performing in different sections of the track, helping to optimize strategies for cornering, acceleration, and braking.
An important metric is lap time, which indicates the duration it takes to complete a full lap. Displaying this information helps teams gauge overall performance and identify areas for improvement. By comparing lap times over different sessions, teams can track progress and make necessary adjustments.
Another critical metric is tire temperature and pressure. These measurements are vital for understanding how tires are performing under various conditions. Displaying tire data helps engineers make informed decisions regarding tire management, ensuring that optimal grip and wear are maintained throughout the race.
Fuel data is also displayed prominently, indicating consumption rates and remaining fuel levels. This information helps teams strategize pit stops and ensure that drivers have adequate fuel for the race duration while maximizing performance.
Additionally, telemetry screens show engine RPM (revolutions per minute), which provides insight into the engine’s performance. High RPMs can indicate peak performance, while any anomalies may signal potential mechanical issues that require immediate attention.
Telemetry screens often display throttle position and brake force data, revealing how aggressively the driver is operating the vehicle. Analyzing this data helps teams optimize vehicle dynamics and driver input for better overall performance.
Finally, data on lap sector times gives insights into specific areas of the track where a driver excels or struggles. This information allows for targeted coaching and adjustments to improve performance on subsequent laps.
Overall, the metrics displayed on racing telemetry screens are essential for ensuring that every aspect of car performance is monitored and optimized, ultimately contributing to the success on the racetrack.
Integrating Real-Time Dash Data for Enhanced Driver Performance
Integrating real-time dash data into racing environments has become a pivotal factor in improving driver performance. By leveraging advanced telemetry systems, teams can collect crucial data that provides insights into vehicle dynamics and driver behavior during races.
The primary function of dash data is to deliver immediate feedback to drivers. Elements such as speed, lap times, tire pressure, and engine performance metrics are displayed in real time, allowing drivers to make informed decisions instantly. This instant visibility helps drivers adjust their strategies on the fly, whether it’s optimizing braking points or maximizing throttle application in cornering.
Moreover, the integration of sophisticated analytics tools takes dash data a step further. By analyzing trends and patterns in the data collected across multiple races, teams can identify specific areas where a driver can improve. For example, data can reveal braking habits, which can be fine-tuned for better corner entry or exit speeds, ultimately leading to improved lap times.
Collaboration between engineers and drivers is also facilitated through real-time data. Engineers can monitor the vehicle’s performance metrics alongside driver inputs, allowing for a dynamic feedback loop. This collaboration ensures that adjustments to the car’s setup can be made swiftly during practice sessions, thus optimizing performance for race day.
Furthermore, advanced visualization techniques and smart dashboards provide an intuitive user interface for interpreting complex data sets. These tools help drivers focus on specific metrics that matter most during critical moments of a race, ensuring that decision-making is both quick and effective.
In conclusion, the integration of real-time dash data is essential for enhancing driver performance. By utilizing this data effectively, teams can create a competitive edge that not only improves individual driver skills but also contributes to overall team success in the high-stakes world of racing.
Customizing Smart Dashboards for Optimal Race Strategy Visualization

Customizing smart dashboards is essential for teams aiming to enhance their race strategy visualization. By tailoring the display elements, data can be organized in a way that prioritizes critical metrics and provides immediate insights into race performance.
The first step in customization involves selecting key performance indicators (KPIs) that matter most for your specific racing context. Factors such as tire degradation, fuel levels, lap times, and driver performance can all be illustrated on the dashboard to aid decision-making in real-time. A well-designed display should highlight these metrics prominently, ensuring that team members can quickly grasp essential information without missing any nuances.
Next, leveraging a modular approach to the dashboard layout allows for flexibility. Teams can adjust the display as the race unfolds, incorporating real-time data and adapting to changing conditions. For example, if weather conditions shift unexpectedly, it may become vital to emphasize metrics related to tire wear or track temperature adjustments. Customizable panels enable the most pertinent data to take center stage, increasing the dashboard’s effectiveness.
In addition to layout and data selection, graphical representation of the information plays a crucial role in clarity. Utilizing color codes, trends, and graphical indicators can streamline the interpretation of complex data sets. A well-chosen visual style allows for immediate recognition of critical issues, such as a sudden drop in performance metrics, facilitating faster responses from the team.
Finally, integrating historical data alongside real-time analytics helps teams establish patterns over multiple races. This historical context enriches the understanding of current performance, enabling strategic adjustments based on past experiences. By incorporating these elements, smart dashboards can more effectively guide strategic decisions, leading to improved outcomes on the track.


